5. Output
5.1. Single location
The location loc of a single window of data (e.g. here) is output as a location object, location, which has attributes:
latitude
longitude
depth
horizontal_scatter
vertical_scatter
starttime
endtime
channels
reduced_displacement (optional…and not well tested)
Each of these values are set to
None,[], ornp.nanif no location was determined (too few stations correlating, location on grid edge, data quality issues, etc.).
channelsis a list of tuples, each containing(channel, sta_lon, sta_lat), that actually participated in the location, andloc.station_latlons()will return a list of channel names and numpy arrays of channel latitudes and longitudes.
5.2. Multiple locations
If you used enveloc to locate many windows (e.g. here), the output locs will be an event_list object XCOR, whose sole attribute is events, where locs.events is a list of location objects [location, location,…]. These can be accessed
by either:
event_list = locs.tolist()
or
event_list = locs.events
where
print(event_list[0])

location(latitude=47.925
longitude=-122.45
depth=20.0
horizontal_scatter=0.0
vertical_scatter=0.0
starttime=2020-05-24T00:00:00.008400Z
endtime=2020-05-24T00:05:00.008400Z
channels=[('PB.B003..EHZ', -124.140862, 48.062359), ('PB.B013..EHZ', -122.910797, 47.813), ('PB.B014..EHZ', -123.8125, 47.513302), ('UW.STOR..HHZ', -121.9888, 47.188099)]
reduced_displacement=None)
The event_list object has several methods to manipulate this list of locations. Among these is the ability to remove locations with too much scatter or null result, event_list.remove()
print(locs)
event_list object containing 191 events

new_locs = locs.remove(max_scatter=5,rm_nan_loc=True,rm_nan_err=True,inplace=False)

print(new_locs)
event_list object containing 140 events
Filter out location objects based on various properties, event_list.filter()
new_locs2 = new_locs.filter(min_lat=48)

print(new_locs2)
event_list object containing 84 events
Or get arrays of location attributes
lats = new_locs.get_lats()
lons = new_locs.get_lons()
starttimes, endtimes = new_locs.get_times()
5.3. Clustering
For some seismic sources, like tectonic tremor or earthquake swarms, it can be useful to look for spatio-temporal clustering of the resulting autolocations and use clustering as a criterion for detection. event_list has the built-in ability to apply spatio-temporal clustering, event_list.cluster(), to create sub-lists of clustered locations
detections = new_locs.cluster(dx=8,dt=60,num_events=4)

print(detections)

DETECTION object with attributes:
(detections: 140 events
all_clustered: 67 events
core_clustered: 60 events
edge_clustered: 7 events
noise: 73 events)
The clustering uses sklearn.cluster.DBSCAN() (documentation and demo) and outputs a detections object which contains different event_list objects
as attributes:
detections - events from original event list
core_clustered - events who all meet the criteria
edge_clustered - events within dx & dt distance of core_clustered event, but don’t themselves have num_events within dx & dt of them
noise - events that don’t meet either criteria above
all_clustered - core_clustered + edge_clustered combined for convenience
This object allows for lists of all events, clustered events, and unclustered events to exist all in one place and be modified using the same class methods. To access the data from a detection object, for example all core_clustered events, simply call
core_list = detections.core_clustered

print(core_list)
event_list object containing 60 events
or get the lat/lon data
clustered_lats = detections.core_clustered.get_lats()
clustered_lons = detections.core_clustered.get_lons()
5.4. Clustering Example
from enveloc.core import XCOR
from enveloc import example_utils
import numpy as np

t1 = '2020-05-24 00:00'
t2 = '2020-05-24 08:00'

FREQMIN = 1.5
FREQMAX = 6.0
LOWPASS = 0.1

sta_list=[
           'PB.B011.--.EHZ',
           'CN.SYMB.--.HHZ',
           'CN.PTRF.--.HHZ',
           'CN.VGZ.--.HHZ',
           'UW.JCW.--.EHZ',
           'PB.B003.--.EHZ',
           'PB.B006.--.EHZ',
           'PB.B001.--.EHZ',
           'PB.B013.--.EHZ',
           'UW.DOSE.--.HHZ',
           'UW.HDW.--.EHZ',
           'UW.GNW.--.HHZ',
           'UW.GMW.--.EHZ',
           'PB.B014.--.EHZ',
           'UW.SMW.--.EHZ',
           'UW.STOR.--.HHZ',
           'UW.TKEY.--.HHZ',
         ]

# get & pre-process data into envelopes
env = example_utils.get_IRIS_data(sta_list,t1,t2,f1=FREQMIN,f2=FREQMAX,lowpass=LOWPASS)

# create XCOR object
mygrid = {'lons': np.arange(-125,-121+0.05,0.075),
          'lats': np.arange(46.5,49.0+0.05,0.075),
          'deps': np.arange(20,60+0.1,4)}

XC = XCOR(env,bootstrap=10,plot=False,grid_size=mygrid,output=1,num_processors=4,regrid=True)

# locate 5-minute windows with 20% overlap:
locs = XC.locate(window_length=300,step=240)

# remove windows with null location and too much bootstrap scatter from list
locs = locs.remove(max_scatter=5,rm_nan_loc=True,rm_nan_err=True,inplace=False)

# cluster
detections = locs.cluster(dx=8,dt=60,num_events=4)

# plot
detections.plot_locations(XC)
which results in the following
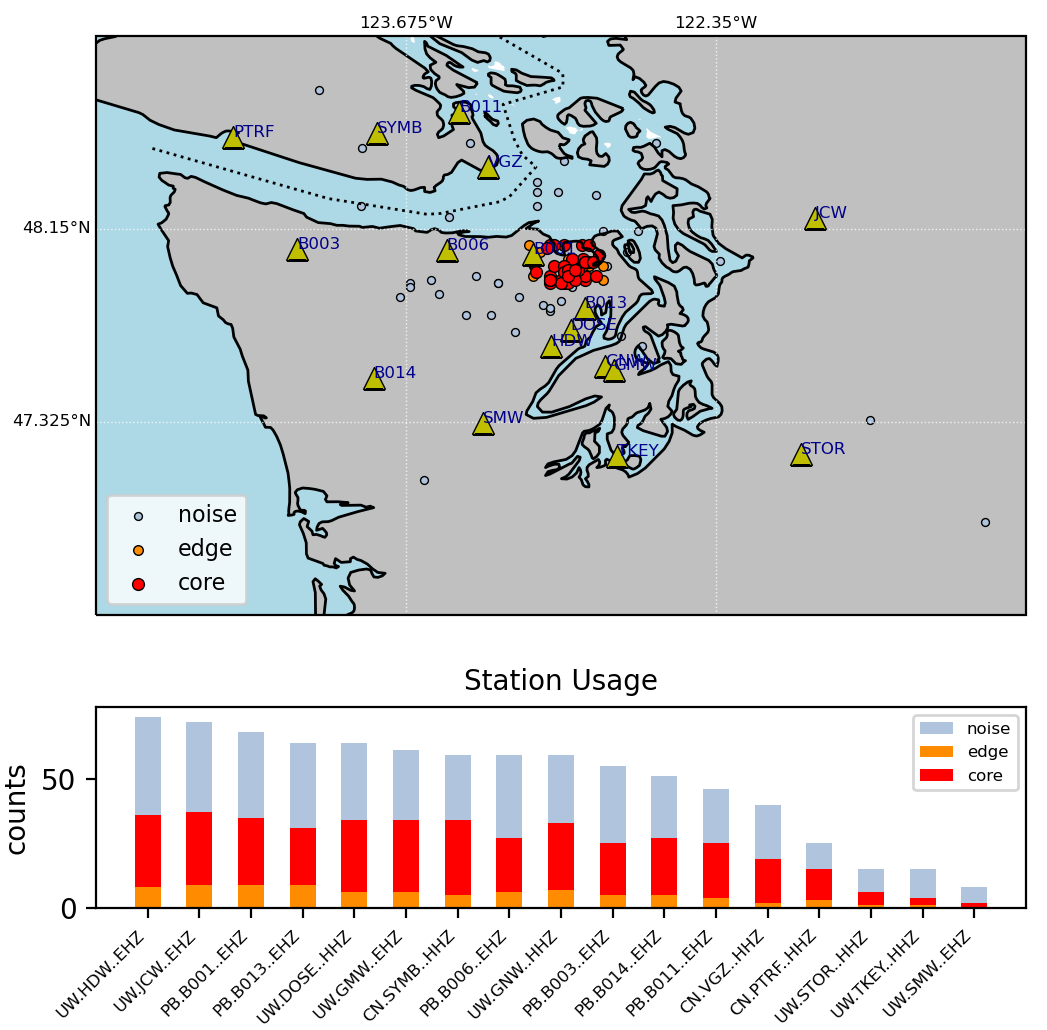
Top: a map of the grid search area with stations (triangles) and detections (dots). Light blue dots represent all successful locations. Red and orange dots represent core and edge clustered events, respectively, as described in the clustering section above. Bottom: histograms of station contributions to all (light blue), edge (orange) and core (red) clustered events.